
Interactive: What's the S&P500?
Here’s a great interactive for students who struggle with the concept of the S&P500 or of an index or mutual fund. For a math teacher, this interactive would be percentage heaven! I blogged about this in October 2014 when most of you were NOT reading this blog so definitely worthy of a repeat post. I have added better questions for your students to answer too. From finviz.com comes this great visualization of the S&P500:
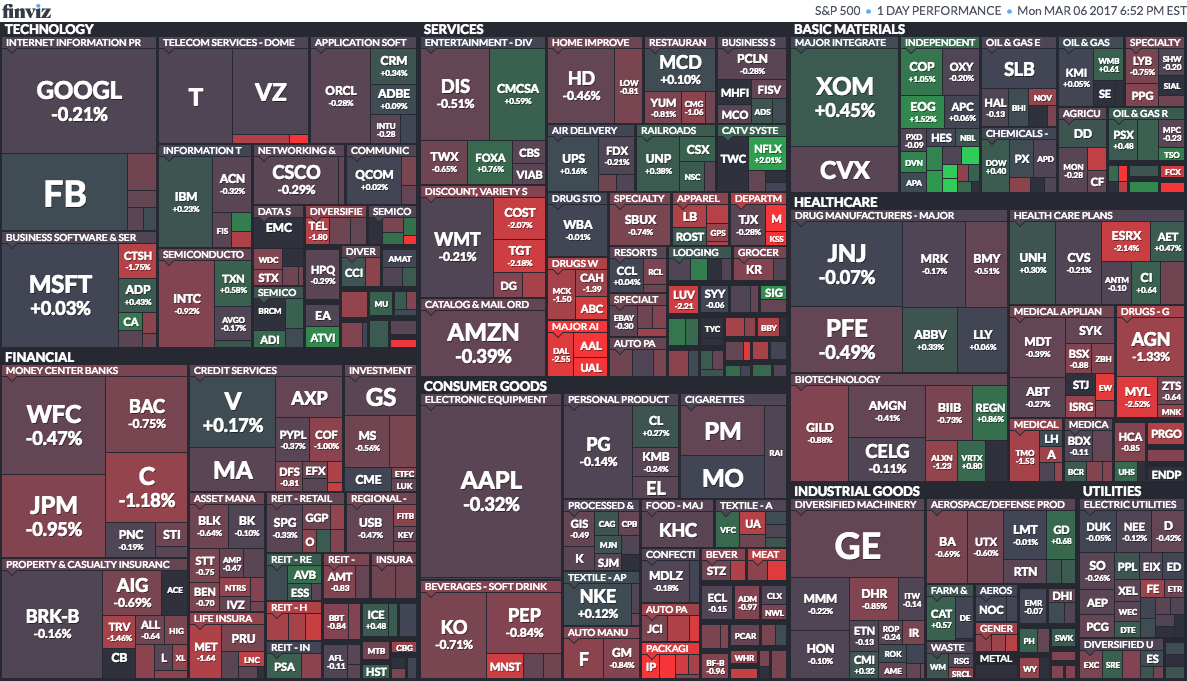
Here’s a description of what you are looking at:
- Each box represents one company in the S&P500; the size of the box represents the size of the company (as defined by market capitalization)
- The letters represent the ticker symbols for the company (e.g, FB = Facebook, AAPL = Apple)
- The companies are grouped by industry (e.g., money center banks, property and casualty insurance and beverages-soft drink)
- The color and percentages represent the change in the stock price (in this case for the day of 3/6/17). The lighter the red, the worse the percentage return for that day. Not much green on this day, but green indicates that the stocks rose on a given day.
The neat thing about this market map is that it is interactive so as a student scrolls over the map, they will get a look at how an individual company performed relative to other companies in their industry. They also have the ability to change the performance time period from one day to one year and YTD. There are also other financial and valuation metrics that can be mapped against this set of companies.
Here’s a few questions for your students to answer after going to this website: https://www.finviz.com/map.ashx. On the dropdown menu, select 1 Year Performance:

- What is your general impression when looking at this overall chart? Do you think the overall S&P500 performance was positive or negative in the past year?
- Which stock performed best in the S&P500 over this time period? Which stock performed worst?
- What can you tell about the Internet Information Providers based on the chart?
- Who are the leading companies (based on size)?
- Are all the companies in the industry about the same size?
- How would you assess the competitive situation in the industry?
- Did they all have a similar stock price performance over the past 12 months? What might explain the differences?
- Did the largest companies perform best over the past 12 months?
- Complete a similar analysis on Services – Discount, Variety Stores industry:
- Who are the leading companies (based on size)?
- Are all the companies in the industry about the same size?
- How would you assess the competitive situation in the industry?
- Did they all have a similar stock price performance over the past 12 months? What might explain the differences?
- Did the largest companies perform best over the past 12 months?
- Complete a similar analysis on Services – Restaurants industry:
- Who are the leading companies (based on size)?
- Are all the companies in the industry about the same size?
- How would you assess the competitive situation in the industry?
- Did they all have a similar stock price performance over the past 12 months? What might explain the differences?
- Did the largest companies perform best over the past 12 months?
- Based on your analysis of these three industries, do you notice any trends about how companies within the same industry performed over the past year, how size might impact performance or how performance might vary across industries?
- Do you think this is an effective way to determine whether or not to invest in a given company? Why or why not?
- If you bought stock in all of the companies in this chart, would this be considered an active or passive investment?
__________
Have limited amount of time to teach investing? Try our “Teach Investing in 2 Hours Lesson!“
About the Author
Tim Ranzetta
Tim's saving habits started at seven when a neighbor with a broken hip gave him a dog walking job. Her recovery, which took almost a year, resulted in Tim getting to know the bank tellers quite well (and accumulating a savings account balance of over $300!). His recent entrepreneurial adventures have included driving a shredding truck, analyzing executive compensation packages for Fortune 500 companies and helping families make better college financing decisions. After volunteering in 2010 to create and teach a personal finance program at Eastside College Prep in East Palo Alto, Tim saw firsthand the impact of an engaging and activity-based curriculum, which inspired him to start a new non-profit, Next Gen Personal Finance.
SEARCH FOR CONTENT
Subscribe to the blog
Join the more than 11,000 teachers who get the NGPF daily blog delivered to their inbox:
MOST POPULAR POSTS
3


